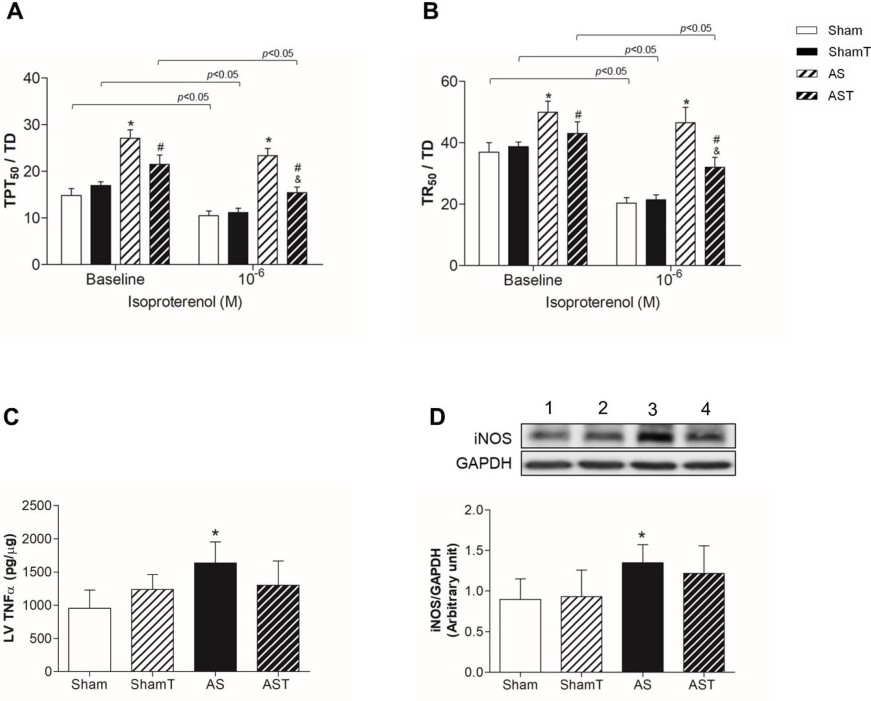
Fig. 6. β-adrenergic responsiveness. Time to 50% developed tension (TPT50, ms) (A) and time from peak tension to 50% relaxation (RT50, ms) (B) evaluated in isolated papillary muscle, and left ventricle (LV) TNFα (C) and inducible nitric oxide synthase (D) levels. Data expressed as mean ± SD. The numbers above representative bands represent Sham, ShamT, AS, and AST, respectively. ANOVA and Bonferroni post hoc analysis. p<0.05. * vs. Sham; # vs. AS. (n = 14-19 each group for β-adrenergic responsiveness and 07 each group for protein expression).